 The
Science Notebook
Gilbert Atomic Energy - Part I
The
Science Notebook
Gilbert Atomic Energy - Part I
This book was published in 1950 as a manual to accompany
the Gilbert Atomic Energy Set that sold for only two years -
1950 and 1951. This set was Gilbert's most expensive at
around $50.00 retail, and even at that price, it lost
money! But it was a beautiful set, and you can see a
full color example here,
And in at least one auction in 2006, a set went for nearly
$8,000.00! See details here.
If such a set were to be offered today, it would probably be
even more expensive in today's dollars, even assuming that it
could be marketed. The cost of even a simple Geiger
counter would be quite expensive, and the atomic sources
needed to complete most of the experiments are very expensive
as well, and are much more extensively regulated than in 1950.
However, some atomic sources are available to educators and
hobbyists. See here.
In 1950, Dr. Gilbert wrote, "There
has been so much misinformation about radioactivity that we
pause here to reassure you and your parents that the
radioactive sources supplied to you are not dangerous in any
way. They have been carefully designed by some of the
nations top scientists to be instructive and harmless. We
assure you that no harm will come to you through daily
contact with the radioactive sources supplied with your
Atomic Energy Lab." (See p.3 below.) His words
were probably true, and the fact is that there remains a great
deal of misinformation about the relative dangers of nuclear
energy and certain radioactive materials, with some even going
so far as to classify this set as one of the most dangerous
toys ever. Regardless, while many of these experiments
or similar could be done at home, they are probably best left
to the high school or college lab, due to both the cost and
need to handle nuclear materials safely.
In the meantime, The Science Notebook
provides yet another glimpse into history when a chosen few
whose parents were willing to shell out fifty bucks could do
something that few kids of that day could do, and even fewer
could do now! Be warned though, that much of the
information contained in this book is outdated and inaccurate.
Therefore, this book is probably best appreciated for
its historical value rather than as a source for current
information or good experiments. If you try
anything here, please understand that you do so at
your own risk. See our Terms
of Use.
Finally, please note that some of the image scans were not of
the best quality. Where numbers or labels are used on
diagrams, every effort has been made to reproduce a legible
image. Still, some are not as clear as we would like.
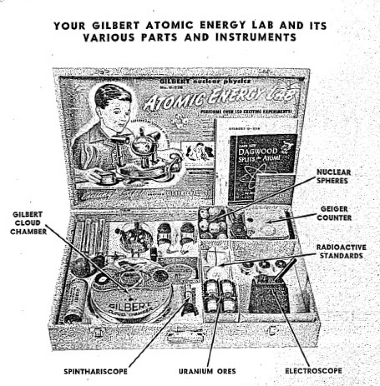
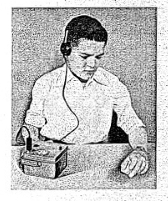
Figure 1-1.
EXPERIMENTING WITH THE
GILBERT GEIGER COUNTER.
Gilbert Radioactive
Source is held near the Counter to produce a clicking in the
headset. Neon tube flashes simultaneously with clicks.
SECTION 1
EXPLORING WITH THE GEIGER COUNTER
One of the first things that will intrigue you when you open your
Atomic Energy Laboratory is the Geiger Counter, which is located
in the upper right hand corner of the box.
To operate your Geiger Counter, follow these steps. First, remove
the circular cap on top of the counter for installation of the
battery. Second, insert one of the flashlight batteries in this
space, making sure that the positive terminal of the battery is
pointing down. (The positive terminal can be distinguished by the
small circular stud at the center of the end.) Now look for the
on-off switch which is located on top of the box. Switch to the on
position and allow your Geiger Counter to warm up. It is now ready
to operate.
You can use your Geiger Counter in either of two ways; (a) You
can count the number of flashes occurring in the neon lamp which
is mounted flush with the rubber grommet in the lid of the box.
(b) You can listen to the clicks in the earphone.
You will find several small plastic sources mounted inside your
Atomic Energy Lab. One of these is marked Radioactive
Standard-Gamma Source. Remove this source from the Lab and bring
it close to the Geiger Counter. When you do this you will note
that the number of flashes or clicks will increase rapidly until
you can hardly count them. Removing the source will cause the
clicking sound or the flashing light to slow down. Later on we
will go into detail and explain what the clicks and flashes are
and what they mean. Meanwhile, we will merely say that each click
or flash corresponds to the detection of a radioactive ray going
through the Geiger Counter.
One thing that you can immediately do with the Geiger Counter is
to ferret out a hidden radioactive source. Let someone in your
family hide the gamma source while you are in another room. Then,
using the ferret, explore the room. Soon, by noting the increased
number of flashes or clicks, you will be able to locate the hidden
source.
If you have a luminescent dial wrist watch or pocket watch or any
other luminescent material try bringing it close to your Geiger
Counter. You will discover that your Geiger Counter will detect
these things. In fact, there are a great many items that are in
every day use which are radioactive. Some of them, indeed, have
quite a powerful intensity.
There has been so much misinformation about radioactivity that we
pause here to reassure you and your parents that the radioactive
sources supplied to you are not dangerous in any way. They have
been carefully designed by some of the nations top scientists to
be instructive and harmless. We assure you that no harm will come
to you through daily contact with the radioactive sources supplied
with your Atomic Energy Lab.
Figure 1-1 shows what is inside the Geiger Counter. You will note
the long slender tube which is supported by two copper electrodes.
This tube is the
3
actual device which detects the penetrating rays and is known as
a Geiger-Mueller Counter
Tube. Now that
you have an inside view of the Geiger Counter we can explain to
you why the instrument hums when the switch is turned On."
Although the Geiger-Mueller Counter Tube requires almost a
thousand volts of electricity to operate sat1sfactorily our only
source of power is a 1-1/2 volt flashlight battery. Here is the
way that we obtain the high voltage necessary from our low voltage
source. First, we have a vibrator unit. This simple device chops
up the direct current from the dry cell and converts it into
pulsating current. You will notice that there are two coils wound
on the vibrator and these together form a transformer. When the
pulsating current feeds into the transformer it is boosted from a
low voltage to a high voltage sufficient to operate the
Geiger-Mueller Tube.
Anyone who uses a flashlight continuously knows that the battery
will wear out. In the same way, your Geiger Counter will stop
operating if you run it continuously for several hours. This does
not mean that your instrument has burned out. It simply means that
you must replace the flashlight battery. Any similar flashlight
battery will be suitable. Just as a flashlight will work for weeks
if it is used only for short periods of time, so, too will the
Geiger Counter run for a long time on a single battery if you use
it for only a short time each day You should remove the flashlight
battery from the Counter if you are not going to use it for a long
period of time. This will prevent battery leakage in the counter
and insure longer life for your batteries. The A. C. Gilbert
Company has manufactured thousands of Geiger Counters and, while
it has taken great pains to insure that each Geiger Counter will
reach you in working condition and remain that way, it appreciates
the fact
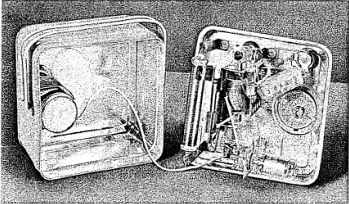
Figure 1-1.
COMPONENTS OF YOUR GEIGER COUNTER
4
that out of the thousands of these sensitive instruments some
will fall to function after a time. Heres what you should do in
the event your instrument does not operate properly.
1) Make sure that the On switch is pushed to the On position.
2) Make sure that the battery has not worn out. Replace with a
spare or a new battery in case you have any doubt.
If no hum from the vibrator is heard after these checks are made,
the chances are that the vibrator has been damaged or has failed.
However, it may happen that the vibrator will work properly but
the instrument will not respond to the radioactive gamma source.
Make sure that it is the gamma source that you are using. If the
neon tube does not flash at all the Counter requires repair. If
the neon tube flashes almost continuously in the absence of the
radioactive source it also requires repair. Do not attempt to
shake the box or otherwise fix the Geiger Counter, Return it to
The A. C. Gilbert Company as per instructions given in the
appendix.
MEASURING RADIATION WITH YOUR GEIGER COUNTER
While it is interesting to have fun with your Geiger Counter by
hunting for hidden sources and showing the instrument off to your
friends, it is far more interesting to make actual measurements as
a scientist would. To go about this we first need a watch or a
clock equipped with a sweep second hand. We start by seeing how
our Geiger Counter behaves when there is no radioactive material
around. The counting rate with no sources present is called the
natural background of the instrument. It is very important for you
to know the background count and to check this periodically to
make sure that your instrument is performing properly. Record the
number of counts for each 15 second period for an interval of five
minutes. Your data should look something like that tabulated
below:
To obtain the average counting rate, you must divide the total
count 74 by the time interval, thus obtaining about 15 counts per
minute. Note that in any one minute the counting rate may swing as
high as 17 or as low as 12. This makes it clear that in order to
obtain a reliable average figure we must take counts over a long
enough time to iron out the variations which occur during any
short time period.
5
|
0-15 Seconds |
15-30 Seconds |
30-45 Seconds |
46-50 Seconds |
Total Seconds |
| 1st Minute |
3
|
4
|
2
|
3
|
12
|
| 2nd Minute |
5
|
4
|
3
|
5
|
17
|
| 3rd Minute |
4
|
4
|
3
|
3
|
14
|
| 4th Minute |
3
|
3
|
5
|
3
|
14
|
| 5th Minute |
5
|
3
|
5
|
4
|
17
|
|
|
|
|
|
Total 74
|
You can do an interesting experiment by simply jotting down on a
place of paper the exact time (reading on a stop watch or a sweep
second hand) when each count occurs. Take data for five one half
minute intervals. The data you obtain should look something like
that listed below:
| 1st Minute |
2nd Minute |
3rd Minute |
4th Minute |
5th Minute |
5
|
3
|
2
|
4
|
1
|
9
|
7
|
5
|
8
|
7
|
13
|
11
|
11
|
18
|
14
|
19
|
18
|
13
|
24
|
21
|
24
|
23
|
21
|
29
|
27
|
30
|
25
|
23
|
|
|
|
30
|
27
|
|
|
|
|
30
|
|
|
RANDOM OCCURRENCE OF COUNT
Note that the occurrence of a count is completely random; that
is, there is no observable regularity to the time when a click
occurs.
GRAPHICAL REPRESENTATION OF RANDOM COUNT
The random nature of the count can also be readily seen from a
graph. This is what you do. On a piece of graph paper mark off a
unit that is to represent a minute and divide this minute into
smaller units which are to represent seconds. Now, by using your
watch, time the occurrence of the counts of your Geiger Counter.
As each count occurs make a line on your graph corresponding to
the time that it occurred. When the minute has elapsed mark off
another set of units and repeat the above procedure. When you have
done this four or five times you will note by comparing the graphs
that the pattern of counts on your graphs is not the same. This is
what we call a random count.
The background counting rate of your Geiger Counter should remain
nearly constant even though you make the measurements on different
days. You must make sure, however, that you always remove the
radioactive sources from the vicinity of the counter when you make
this measurement. It is also desirable to perform the experiment
in the same place each time. The reason for this is that
everything about us has some radioactivity and as we move to
different places we are likely to encounter different amounts of
radioactivity. Even the human body is slightly radioactive. The
air we breathe contains small amounts of radioactive material. The
earth and building materials contain more significant quantities
of radioactive elements. No matter where we go we can never really
be free from some small amount of radioactivity. We call this
residual counting rate the radioactive background..
6
THE RADIOACTIVE SOURCES
Perhaps by now the user of the Atomic Energy Lab has been
impatient to explore the properties of the radioactive sources
marked alpha, beta, and gamma. First, bring the source labeled
alpha up to the counter. Note that it has no recognizable effect
on the counter. This should not disturb the user for there is
nothing wrong with the source. It means that the type of ray
emitted by this source is much different from the gamma ray. We
call it the alpha ray. Alpha rays are easily absorbed in any solid
substance or even in air and they are not able to penetrate the
wails of the Geiger Counter.
The source marked beta does have an effect upon the Geiger
Counter. In order to observe it, the source must be brought close
to the Geiger Counter. Obviously the ray emitted from this source
is more penetrating than the alpha ray, but it still is no match
for the powerful gamma ray. We call these rays emitted from the
beta source beta rays. We shall later learn that beta rays are
simply high speed electrons. For the time being, however, we will
concentrate our attention solely upon the gamma rays.
One can have a great deal of tun playing hide and seek with the
gamma ray source. Obviously, this game takes two or more people to
play it. The person who is selected to find the gamma ray source
is given the Geiger Counter and told to wait outside the room
while the others hide the source. Then, after the source has been
hidden, the outsider is invited in and told to look for it. Prizes
can be awarded to the person who finds it in the shortest time.
HOW FAR AWAY CAN THE SOURCE BE DETECTED?
Let us see how far away from the source we can get with the
Geiger Counter and still detect the presence of the source through
an increased counting rate. To perform this experiment place the
source in the open, lets say in the center of a large room. Then
lay a tape measure in a straight line away from the source.
Starting at a distance of six feet away from the source, make a
measurement of the counting rate. You will find that at this
distance the rate is about that of the background count. Now, move
the source a foot closer to the Geiger Counter. The Geiger Counter
tube inside the Geiger Counter is located almost entirely under
the words Model U239 and this is an excellent spot to measure
from. We can then speak of the source to counter distance in exact
terms. Move the source in steps of a foot or a half foot closer to
the Geiger Counter. Record the counts per minute for each
distance. You should be able to take measurements up to six inches
from the Geiger Counter.
At this point the counting rate will be very high. The count may
be over 200 counts per minute. (Counts per minute is often
abbreviated to read c.p.m.). You need to use a trick to count so
rapidly. On one of your data sheets, make a large cross so that
you can record data in four groups. In each quadrant, or section,
of the cross make a pencil dot for all counts occurring in a 15
second interval. In this way you do not need to keep counting, but
simply jab at the paper every time a click or a flash occurs. By
dividing the data into four 15 second intervals, you can look at
the consistency of your counting. At your leisure you can count up
the number of dots in each quadrant and, with a little practice,
you will be able to count 200 c.p.m. with fair accuracy.
7
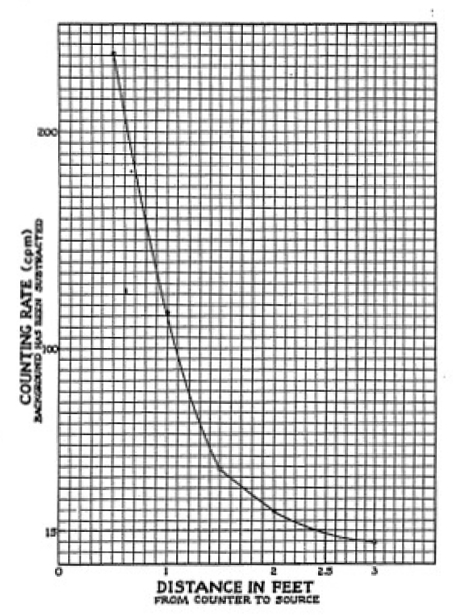
Figure 1-2.
COUNTING RATE AT VARIOUS DISTANCES
FROM THE GAMMA SOURCE
From each reading, subtract the background counting rate. Your
data should then appear as follows:
Since the counting rate really expresses the number of gamma rays
at any one point we may call this the intensity. Thus, we have
obtained experimental data on the intensity of gamma radiation (rays per
minute) from a small source for various distances away from this
source.
We have taken data for a number of distances. Now, we shall put
this data on a chart
or graph so that
we can read off the intensity or counting rate at any distance. To
do this we take a piece of graph paper, preferably one ruled with
large squares. We mark off on the horizontal scale the distances
in feet, which represent the distance separating the source from
the counter in our experiment. Then on the vertical scale we mark
off appropriate units for the
8
| Distance |
Counting Rate (C.P.M.) |
8"
|
236
|
1 ft.
|
104
|
18"
|
43
|
2 ft.
|
23
|
3 ft.
|
10
|
| Greater than 3 ft. |
Close to Background Count |
counting rate. It you are not familiar with the technique of
plotting points on graph paper and if it is not readily apparent
to you how this is done, you may check with your science teacher
for some assistance.
To plot our data on the graph, we take a given set of readings,
say 43 c.p.m. at 18. We run a pencil along the horizontal scale
until we find 18 (1. 5 feet). Here we make a mark. Then we run a
pencil line upward (parallel to the vertical scale), stopping at a
point which is opposite 43 on the vertical scale. Similarly we
establish points for the other sets of data until all the data is
plotted. Now we can sketch in by hand a smooth curve connecting
all these points.
Now, you can estimate the intensity of gamma radiation at any
point from six inches to thirty six inches. It is done like this.
From some random distance on your horizontal scale draw a line
upward until it intersects the curve. From this point draw a line
parallel to the horizontal scale over to the vertical scale. At
this point on the scale you can read off the counts per minute,
which is the approximate count for your random distance. Thus one
reads an intensity of 15 c.p.m. at a distance of 2.5 feet. Figure
1-2 illustrates the relationship between the distance from the
Geiger Counter to the gamma source and the counts per minute (c.
p. m.).
Relationship Between Intensity and Distance.
The most obvious fact to learn from the curve in Figure 1-2, or
the curve that you have drawn, is that the intensity (c. p.m.) of
gamma radiation drops off very rapidly with increasing distance
from the source. Let us look a little more closely at the exact
way in which this intensity drops off and see if there is any
rhyme or reason to it. The intensity at one foot is roughly 100.
If we double the distance we find that at two feet the intensity
drops to about 1/4th of its one foot value. Thus, by doubling the
distance, we decrease the intensity by a factor of 4, or, to put
it another way, the number of counts is 1/4th as many when the
distance is doubted. There are only about 1/9th as many counts
when the distance is tripled. Examine your curve or Figure 1-4 and
you will see that this is true. Whenever a quantity behaves this
way, it is said to obey the Inverse Square Law.
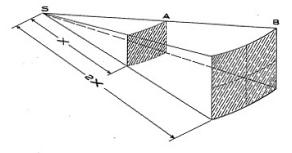
Figure 1-3.
UNDERSTANDING THE INVERSE SQUARE
LAW
9
The Inverse Square Law is one which is good for more than just
gamma rays. It applies to radiation emitted by an ordinary light.
You can verily this fact by taking a light meter such as the
direct reading type used by photographers and take readings of the
light intensity at various distances from a lamp bulb. You should
find that the observations will confirm your experience with gamma
rays.
By glancing at Figure 1-3 you may be able to see a little more
clearly how the Inverse Square Law works. We have a source located
at S. At some arbitrary distance which we shall call X, we measure
the counts or radiation intensity. Let us say that 100 rays pass
through the area at X distance from the source. Now looking at the
next area which is 2X, or twice as far from the source as the
first area, we see that it has an area 4 times as large as the
first area.
As the 100 rays are still radiating in the same direction, we
find that the 100 rays are passing through 4 times the area, while
in any small portion of that area there are only 1/4th as many
rays as before. So it may be concluded that, as the distance is
doubled, the Intensity, or the number of rays passing through the
same amount of space, is divided by four or 1/4th as much. The
same situation would prevail if the distance were tripled, except
that there would be 3 squared or 9 times the area and the
intensity would be divided by 9 or be 1/9th of the original
intensity.
More About Gamma Rays
The experiment which we have done with gamma rays may not yield
the same data to all observers. To check this assertion, try
making the same kind of measurements varying the local conditions.
Perform the experiment first on a concrete floor. Then, prop your
source and counter up on two cardboard boxes so that you make the
experiment up in the air away from heavy materials such as
concrete. You will observe differences and they will depend upon
precisely what solid objects are close to the gamma source and to
the Geiger Counter. Gamma rays can penetrate concrete and are also
scattered by concrete.
Absorbing the Gamma Rays
So far we have investigated the effect which the distance from
the source to the counter has upon the counting rate. Now, Let us
turn our attention to the problem of seeing what effect various
materials have upon the counting rate. One of the most common
materials that one usually has around the house is wood, so we
shall use this for our first experiment of measuring the
absorption of gamma rays.
For this experiment it will be most useful if one selects pieces
of wood (if wood is not readily available, you may use books
instead) one inch in thickness and larger than the width and depth
of the Geiger Counter. Set up the equipment as shown in Figure
1-4. First, with no slabs of wood in between
10
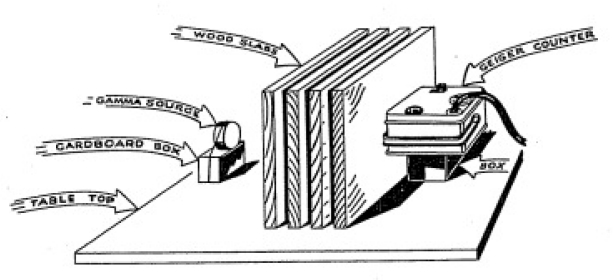
Figure 1-4.
HOW THE GAMMA RAY ABSORPTION EXPERIMENT IS SET UP
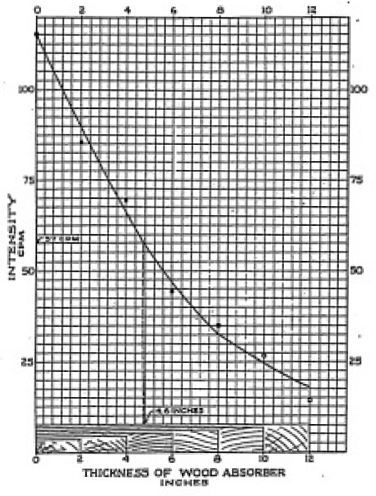
Figure 1-5.
GRAPH SHOWING HOW WOOD THICKNESS AFFECTS INTENSITY
the counter and source, measure the counting rate and put this
value in your note book as shown below:
Thickness of Wood
|
Counting Rate (C.P.M.)*
|
0 Inches
|
115
|
3
|
86
|
4
|
69
|
6
|
44
|
8
|
35
|
10
|
27
|
12
|
14
|
*
Counter to source distance = 12 inches
11
Then, insert one piece of wood and measure the counting rate
carefully. Repeat this measurement for each piece of wood added
until finally the counting rate is so low that it is almost the same
as the background count.
By inspecting the various counting rates we can see that the
intensity of the gamma rays drops off sharply. To be more
scientific, we have to resort to graphical means of representing
the data which we have thus obtained.
Figure 1-5 shows just how we construct a simple graph. The
horizontal scale represents the thickness of wood used as an
absorber. The vertical scale shows the counting rate. As before,
we plot each set of points on the graph remembering that we must
use the corrected counting rate; that is, the measured counts per
minute minus the background count. When we have the string of
points spotted on the graph, we draw a continuous line through
them as shown in Figure 1-5.
You may find that your points if connected by a series of
straight lines would make a rather ragged curve. This is due to
the uncertainty in each measurement plus effects due to the
scattering of the gamma rays. You may avoid this difficulty by
drawing a smooth curve on the graph which seems to come closest to
ail the points.
Half Thickness
Now that we have a smooth curve we can pick off the graph the
intensity for any thickness of wood or we can determine what
thickness of wood is required to reduce the initial intensity
(with no absorber) by a given amount. The thickness of absorbing
material which just reduces the counts per minute by 1/2 is called
the half thickness. Examine Figure1-5 and you will note that the
number of counts per minute is halved at a thickness of absorber
material of about four and one half inches. Check the graph that
you have made, and determine the half thickness of the material
that you used as an absorber.
While you may not have realized it in doing the experiment on
absorption, it is important to keep the source and the instrument
at a fixed distance from each other. If one did the experiment by
simply sandwiching the absorber between the counter and source
then no simple relation between absorber thickness and intensity
would be obtained. Every time a new absorber would be added to the
sandwich the relative distance and therefore the counting rate
would be changed. The size of the absorber itself has some
influence on the observed intensity for some of the radiation is
scattered and introduces a complicating effect.
As a gamma ray whizzes through matter it completely disregards
the atoms of the matter through which it is passing; that is,
until it finally makes one collision with a single atom. Then it
hands over all of its energy to an electron in this atom.
Thereupon, the electron is quickly stopped because it, unlike a
gamma ray, does not disregard the influence of atoms around it.
When a gamma ray is emitted from the gamma source, it may either
travel through a fraction of an inch in the wood or it may travel
through all twelve inches. On the average, considering the mass
behavior of thousands of gamma rays, there is a higher
probability, however, that the gamma ray will be stopped in the
first few layers of the absorber.
12
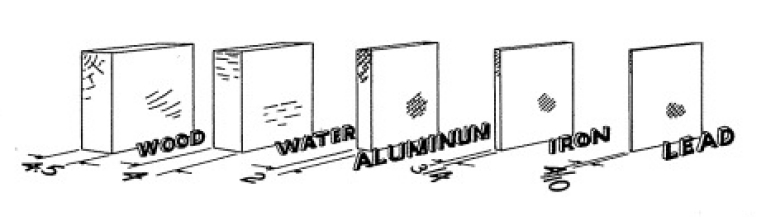
Figure 1-6.
COMPARING DIFFERENT MATERIALS AS ABSORBERS
Shown above are the
half-thicknesses of wood, water, aluminum,, iron, and
lead. Thus 3/4 inch of iron will absorb as much gamma
radiation as 4 inches of water.
Different Kinds of Absorbers
Let us now see how materials other than wood work as absorbers.
Perhaps the easiest material to obtain is iron or, in some cases,
aluminum may be readily available. Such objects as a frying pan or
other kitchen utensils are good examples. Other obtainable
materials with which you can experiment are tin, glass, crockery,
rubber, plastic, cloth, paper, sand, brick, lead, brass, putty and
so on.
Using absorbers of whatever material you can obtain repeat the
absorption experiment. As before, plot your results on a graph.
Note that the same kind of curve is obtained as we found for wood
but that the half thickness value for Iron or aluminum is much
less than for wood. 1f you have sheets of lead available, you will
be able to verify that the half thickness is still less for this
heavy element. Our use of the half thickness is a convenient
yardstick by means of which we can compare the gamma ray
absorption in different materials. By it we can say that one inch
of wood is equivalent to one-tenth of an inch of lead. In other
words, lead absorbs gamma rays 10 times better than wood. Now, if
you had access to all the different common elements and could
carry on experiments with them, you would be able to obtain half
thicknesses for these and make a graphical comparison such as is
shown in Figure 1-6.
Physicists customarily use an abbreviated unit for measuring
gamma ray energy. This unit is called the Electron Volt, and more often
a larger unit, one million electron volts is used. This is
abbreviated one MEV. This unit we shall use in talking about gamma
rays. Our Atomic Energy Lab gamma source for example is found to
emit a 1.14 MEV gamma ray.
The advantage of having a convenient unit for talking about gamma
rays is that we no longer have to be so vague as to say, In this
experiment we use a soft gamma ray. .. Rather we can be accurate
and say Here we use a 0.35 MEV gamma ray.... The larger the MEV
of a gamma ray, the greater is its half thickness and the greater
is its penetrating power. Gamma rays having energy above one MEV
are usually thought of as being high energy rays.
13
RADIOACTIVE ORES
Included with your Atomic Energy Lab are four glass bottles
containing samples of radioactive ore. Sample No. 100 contains
some pieces of Carnotite taken from the Colorado plateau region.
Carnotite is bright yellow in color. Your sample, however, may be
of greyish or brownish cast due to the presence of iron. Consult
your booklet, Prospecting for Uranium, for more information
about the occurrence of this ore.
To make a rough measurement of the radioactivity of your sample,
place the glass bottle next to the Geiger Counter, locating it as
close to the Geiger tube as possible. The counting rate that you
will obtain will depend upon the strength of your particular
sample. It should be somewhere between 35 and 100 counts per
minute.
Make the same test to determine the radioactivity of the other
samples and record the data in your note book. You will probably
find that the Carnotite is the most active of the samples with the
Autunite being the next most radioactive. The Torbernite and
Uraninite will be quite weak and may only register about 50% over
the background rate.
All these samples except the Autunite have been sealed in bottles
so that you will not open them. The Autunite is not sealed and you
can remove the pieces from the jar. The other samples have been
sealed for they tend to flake and crumble and you would run the
risk of having radioactive ore spread out in your laboratory. This
will raise the level of the background count. The Autunite is
sufficiently hard so that it does not crumble readily and you may
handle it outside of the container. It is well, however, to place
pieces of the ore in a thin paper sack so that small bits of the
ore do not contaminate your laboratory.
Place the packaged Autunite next to the Geiger Counter and again
record the counting rate You should note a very decided increase
in the count. Your counting rate should increase at about a factor
of four or five. How do we account for this big increase? It is
true that we have spread the old sample out more so that more of
it is closer to the Geiger Counter. This, however, would not
account for such a big increase. We must conclude that the ore
emits some kind of radiation which is absorbed by the thick glass
wall of our sample bottle. We can verify this by slipping a plate
of glass in between our Geiger Counter and this Autunite and
determining the counting rate again. This time we will find that
it drops off, showing that we were correct in assuming that some
other easily absorbable radiation is present. This type of
radiation consists of
beta rays which are also emitted by our beta source.
Introducing Beta Rays
Up until now our experiments have been mostly with the gamma
rays. We deliberately refrained from introducing the beta source
in order not to confuse you by meeting many new particles in the
early part of your experimenting. Now we shall describe beta
radiation very briefly, leaving until a later chapter the more
detailed discussion of the subject.
14
Absorption of Beta Particles
Let us first measure the absorption of beta particles in some
light material such as cardboard Take some stiff cardboard, not of
the corrugated variety and cut up a dozen or so pieces large
enough to cover the beta source. Prop up the beta source by taping
it to a little paper box and face it toward the side of the Geiger
Counter which contains the Geiger Counter tube. Place the Geiger
Counter about 12 inches or so from the source. At this distance
you will get a counting rate of about 100 or more c.p.m. Now place
one piece of cardboard after another between the source and the
counter taking a reading for each absorber added. You will find
that a one centimeter layer (a little larger than 1/3 of an inch)
of cardboard absorbs most of the beta rays. Twice as many
centimeters of cardboard absorbs the beta rays completely. Use the
plastic rule supplied with your Atomic Energy Lab in order to
change from inches to centimeters.
As another experiment you can substitute thin sheets of metal for
the cardboard and note that the beta particles are completely
stopped by as little as seven-tenths centimeters of aluminum or
three-tenths centimeters of iron. From this we can conclude that
our Geiger Counter would not be able to detect beta rays at all if
the Geiger Counter tube were packaged in a heavy steel box.
In working with your Geiger Counter and beta source you may often
find that an experiment will produce a puzzling result,or two
experiments which you think should produce the same result will
yield inconsistent data. For example, il you place the beta source
a given distance from the Geiger Counter and have the beta source
suspended in air so that nothing solid is close to it, you may
find that the results with the Geiger Counter are considerably
different from those obtained with the source placed upon a table
top or backed with wood. Furthermore, even in air the course of a
beta particle is not a straight line, but an irregular path. Thus,
in making absorption measurements, it becomes important that you
consider where you place your absorber in respect to the source
and to the Geiger Counter. Furthermore, the size of the absorber
becomes important since this will affect the scattering of the
beta particles.
PROSPECTING FOR URANIUM
As a result of our war-time development of Atomic Energy the
element uranium has assumed great importance in our national
affairs. Uranium is a very heavy metallic element, but it does not
occur in metallic form in nature. Nevertheless, there are over 100
minerals which are uranium bearing. These are widely distributed
over the face of the earth. There are, however, only very few
deposits of uranium ore which are rich in uranium. Most of the
uranium which has been mined has been taken from veins of
pitchblende located as follows: Shinkolobwe in the Belgian Congo,
Eldorado in Canada, and .Joachimsthal in Bohemia. In these
localities, especially in the Belgian Congo, uranium occurs in
very rich deposits.
A prospector equipped with a Geiger Counter can use his
instrument as an aid to discovering deposits of uranium ore. There
are, however, some very
15
definite difficulties in prospecting for uranium and you should
not feel that you can dash out and discover new deposits of the
precious ore. First, while uranium is a relatively abundant
element (ranking with lead in terms of abundance) it is usually
found in very little concentrations so that detection is
difficult. Secondly, the ore may be covered over with
non-radioactive rock in which case the radioactivity of the ore
itself is smothered by absorption in this rock. The booklet
entitled Prospecting for Uranium" included in your Atomic Energy
Lab contains details about uranium prospecting. The booklet is an
official one prepared jointly by the Atomic Energy Commission and
the U. S. Geological Survey. No matter where you go on the surface
of the earth, you will find that your Geiger Counter never ceases
to have a steady background counting rate. By and large this
background rate does not vary much from one place to another,
although, if you happen to be standing near a pitchblende deposit
the rate would be increased. If we do not consider such a special
case we know that the background is ordinarily fairly constant. It
must be due to radiation in the immediate vicinity of the counter.
Suppose we list the various sources of radiation which may cause
clicks in the Geiger Counter:
1) We know that radioactivity in the earth bombards the counter.
2) We know that building materials contain a small fraction of
radio active substances which also contribute to the counting
rate.
3) We know that the materials in the Geiger Counter itself are
very slightly radioactive and give rise to counts.
4) Finally we know that there is a slight amount of radioactive
material in the air and human beings which might contribute to the
counting rate.
SHIELDING
In order to eliminate some of these sources of radioactivity let
us surround the Geiger Counter with layers of heavy substances on
all sides. Allow the cord to the ear phones to come out one side
of shielding material so that the counting rate may be measured.
Lead is an ideal substance for you to use for this experiment, but
since you may not have this in your home, you may substitute
another material such as iron or copper. If you happen to be an
apartment dweller with no such items at hand, then you may perform
the experiment in your science laboratory at school. Shielding the
counter on all sides with an inch or two of solid lead, or with a
thicker layer of less dense material, would be expected to reduce
the radiation from sources in the vicinity of the counter. It
would not, of course, shield against the radio active materials in
the counter itself, but, we can easily show by using another
Geiger Counter that the radioactivity of the instrument itself is
very small.
Make a careful measurement of the counting rate with the shield
in place. Count for at least 10 minutes in order to get a good
average rate. Then, make a similar measurement of the counting
rate-with no shield around the counter. You should obtain a
definite decrease in counting rate when the
16
shielding is in place. The exact amount of the decrease will
depend upon the amount or type of shielding, but in general a
thick shield on all sides should decrease the counting rate by
about a third.
Since we have successfully reduced the effect of radiation from
the surroundings we are justified in asking what the Geiger
Counter registers when it is shielded. One might suspect that the
radioactivity in the shielding material might be the culprit, but
we know from experience that lead is not radioactive so we can
eliminate this as a contributing factor. What then do we have left
as the cause of the remaining clicks in the Geiger Counter?
Evidently the radiation which continues to cause the Geiger
Counter to click even with very heavy layers of lead or iron
around it is much more penetrating than the rays which are emitted
from our radioactive sources. Scientists, such as Robert A.
Millikan and Arthur H. Compton have devoted much of their life
work to the study of these very penetrating rays which we shall
call Cosmic Rays. These rays are
quite different in their nature from gamma rays. They are actually
sub-atomic particles traveling with very high speed. These new
particles are called Mesons
although the name Mesotron
is sometimes used too.
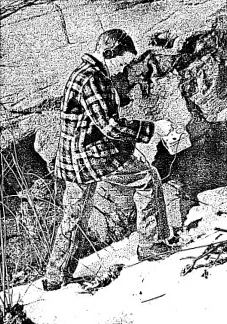
Figure 1-7.
YOUNG PROSPECTOR HOLDING THE GILBERT GEIGER COUNTER NEAR A ROCK
FORMATION TO TEST FOR
RADIOACTIVITY.
17
COUNTING ON THE MOUNTAIN TOP
As a first experiment we can go on a mountain top. A hill or a
small elevation will not be enough. The mountain has to be more
than a few thousand feet high to obtain a noticeable effect. Some
of you may go into the mountains in the summer. If so, take your
Geiger Counter along and it will be useful for prospecting too.
Before you start on your trip check the counting rate at the
starting point or at sea level if possible. As you get higher in
the mountains check the counting rate at each elevation. In Denver
or in places equally high you will notice that the counting rate
is appreciably higher than at sea level. As you progress to still
higher altitudes the rate increases more quickly.
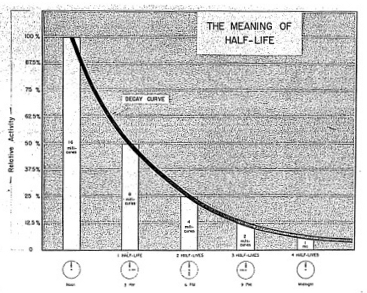
Figure 1-8.
A RADIOACTIVE DECAY CURVE
All radioactive atoms obey some kind of decay rule, decreasing
in activity by 50% at the end of the first half-life and by
another 50% at the end of the second half-life. Thus one
curve applies to all atoms whether they are long lived
or very short-lived. For clarity a set of values for
cesium-134 with a 3 hour half-life has been included.
All radioactive atoms obey the same kind of decay rule,
decreasing in activity by 50% at the end of the first half-life
and by another 50% at the end of the second half-life. Thus one
curve applies to all atoms whether they or. long lived or very
short-lived. For clarity, a set of valves for cesium-134 with a 3
hour half-life has been included.
18
COUNTING IN AN AIRPLANE
The modern commercial aircraft customarily travels at quite high
altitudes especially on trips of any length. If you happen to take
a trip by air, be sure to carry your Geiger Counter along. You can
ask the stewardess for the various altitudes as the plane climbs
or dives and perhaps the captain will allow you to visit the
cockpit where you can read the altitude for yourself. Be careful
in taking your measurements to get a background reading at sea
level for many aircraft have numerous radiant dials on the
instrument panel and to a lesser extent throughout the cabin. You
will notice that at high altitudes the count is quite high. This
increase in counting rate is due to cosmic rays.
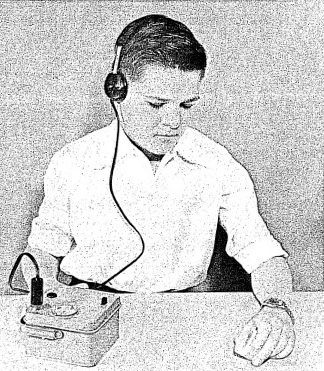
Figure 1-9.
EXPERIMENTING WITH THE GILBERT GEIGER COUNTER.
19
HALF LIFE
Another important term which is often used in nuclear physics is
Half Life. Figure 1-8, the
decay curve, illustrates the meaning of half life. The half life
of a material is the period of time in which half of the initial
amount of the radioactive material will have disappeared. Thus, it
will take 4.5 billion years for 100 atoms of U-238 to decay so
that only 50 are left. At the end of another 4.5 billion years
only 25 of the initial 100 U-238 atoms will be present.
Some radioactive substances have very short half lives. For
example, in the uranium series, radium C has the value of
1/6000th of a second. On the other hand Tellurium 130 has a half
life of 1.56 trillion years.
The great range of half life values from billions of years to
billionths of a second is a colossal one. Yet the same behavior so
far as decay is concerned is observed by the longest and the
shortest live atoms. Let us consider as a specific case a
radioactive emitter which has a half life of 3 hours. Since we are
going to deal with very largo numbers of atoms it is not
convenient to talk about a million or a billion atoms, for these
units would in many cases be too small for our purposes. A single
gram of radium emits 37 billion alpha particles per second and
physicists have elected to use this value as a standard and to
give it the name of one curie
in honor of the discoverers of radium.
Smaller units are the mille
curie
(abbreviated mc) and the micro curie (uc) corresponding to 1,000 and
1,000,000th of a curie respectively. Later on we will explore
further the meaning of this unit of radioactivity, but for the
present we should think of it as merely a unit which tells us how
much radioactivity there is in a sample of material.
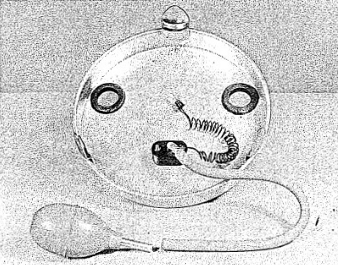
Figure 2.2.
BOTTOM VIEW OF THE GILBERT CLOUD CHAMBER
20
"The Science Notebook"
Copyright 2008-2018 - Norman Young